Most of us are aware of the ‘normal’ menstrual cycle, 28 – 30 days with ovulation occurring around day 14.
What you may or may not know is that most of us don’t run like clockwork! You can ovulate anywhere from day 9 to day 28.
You can even have a regular menstrual cycle yet not ovulate at all.
Once released at ovulation, an egg will be viable for 24 hours so knowing when this is greatly increases your chances of conception.
Sperm need to be present within your reproductive system during this tiny 24-hour window for conception to occur. Sperm live a little longer than our eggs and can stay viable in our system for between 3 – 5 days so your most fertile days fall 3 days before and on the day of ovulation.
So how do you know when or even if you’re ovulating?
One of the easiest and most popular ways to pin point your unique fertile window is to chart your temperature.
The hormonal changes that occur during the menstrual cycle influence our Basal Body Temperature (BBT). By charting your temperature each morning you will begin to establish a pattern that reflects your individual changes.
Using a digital or mercury oral thermometer, you need to take your temperature via mouth (or vaginally, however whichever method you use, you must stick with this method as vaginal temperature is slightly higher than oral temperature) at the same time each morning before you get out of bed.
You need to have had at least 3 hours sleep and must not eat before taking your temperature as this can interfere with the accuracy.
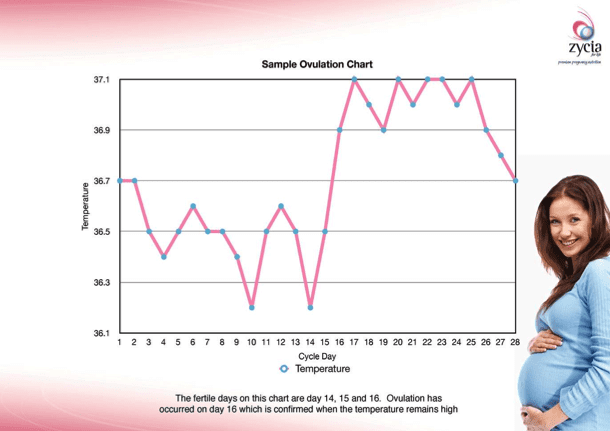
When you ovulate your temperature will rise and remain higher for at least 10 days before dropping back to the starting temperature ready for the next menstrual cycle to commence. Your most fertile days fall 2-3 days before temperature reaches it’s peak and for about 1 day after.
You should also notice a slight drop in temperature before the rise. This drop can help you predict that ovulation is about to occur, indicating that you are commencing your fertile period.
When charting your temperature it’s important to be mindful that other external factors, aside from hormones, can influence basal temperature. These include:
- Being unwell
- High stress levels
- Shift work
- Interrupted sleep
The below chart is an example of the temperature changes you would expect during a ‘normal’ menstrual cycle. Your chart will not necessarily be identical, but should show the same drops and peaks in temperature.
If no changes are noticed, this may indicate that you are not ovulating.

You can record your temperature in a journal or you may wish to download free charts from the Tools and Resources section of the Zycia website. Alternatively you can download a free iPhone app to record and store your results.
Whatever method you choose to record your results, stick with it. The longer you chart your temperature the better you will begin to recognise your unique ovulation patterns.
Knowing your body and when you ovulate greatly improves your chances of conception each month. It’s also a great way to get in touch with your body to really understand your cycle so you can more easily recognise any changes, symptoms or abnormalities.


1:13 pm
2:47 pm
12:23 am
6:09 pm
1:47 pm
1:34 pm
8:53 am
10:03 pm
10:10 pm
3:00 pm
1:35 pm
8:50 pm
-

-
-
mom94125 replied
- 18 Oct 2015 , 4:42 pm
Reply9:25 am
9:54 pm
10:49 am
6:56 pm
2:23 am
10:52 pm
10:10 pm
9:11 pm
- 1
- 2
- »
Post a commentTo post a review/comment please join us or login so we can allocate your points.